
RSI - Relative Strength Index |
Charts by TRADINGVIEW
|
|
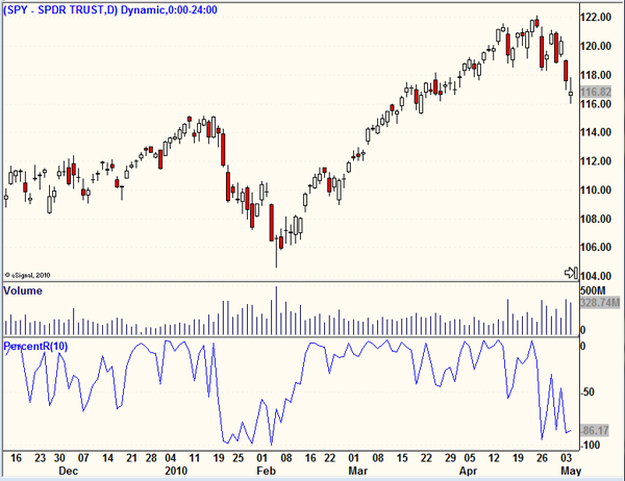
RSI Definition:
The Relative Strength Index (RSI) oscillator helps identify overbought and oversold areas. The RSI calculates a value based on the cumulative strength and weakness of price, specified in the input price, over the period specified in the input length. For that number of bars, RSI accumulates the points gained on bars with higher closes and the points lost on bars with lower closes. These two sums are indexed, with the index plotted on the chart. Background: The RSI plots as an oscillator with a value from 0 to 100. The direction of RSI should confirm price movement. For example, a rising RSI confirms rising prices. RSI divergences can help identify reversal areas. For example, a new high in price without a new high in RSI may indicate a false breakout. RSI can be used to help identify overbought and oversold conditions when the RSI value reaches extreme highs or lows. Its usual to plot horizontal reference lines at certain levels such as the 30 & 70 or 20 & 80 serving as visual aids. RSI entry and exit signals are typically the most meaningful when the price and volume of the chart being analyzed have also set up a bullish or bearish pattern. Practical Use: Using the RSI for additional confirmation of what has already been "read" in the chart can be a powerful addition to the assessment tools used by a technical analyst. |

RSI Active Chart Examples |
Charts by TRADINGVIEW
|