
MACD - Moving Average Convergence Divergence
|
Charts by TRADINGVIEW
|
|
Definition:
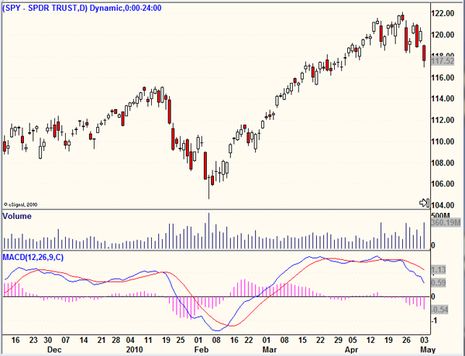
The MACD or “Moving Average Convergence Divergence” oscillator assists in indicating the momentum in trends. The MACD is calculated by first plotting two exponential moving averages of varying length. A moving average of the difference between these two exponential moving averages is then plotted as the “signal line.” Background: The difference between the MACD and the signal line is calculated and often plotted as a histogram. Typically, the best MACD signals occur when the price and volume of the chart being analyzed has also set up a bullish or bearish pattern. Using the MACD for additional confirmation of what has already been “read” in the chart can be a powerful addition to the assessment tools used by a technical analyst. Practical Use: Technical analysts will often use the MACD in several ways. The most popular way is just using the signal line. If the signal line crosses from below zero to above zero, a long position might be taken and if the line crosses from above zero to below zero, a short position might be taken. A second method uses the histogram. If the histogram is ticking above zero, a long position might be taken. If it is below zero, a short position might be taken |
Get 6 trading tutorials emailed to you: Click here

MACD Active Chart Examples |
Charts by TRADINGVIEW
|