
Grok Trade Educating 36,257 traders from 162 countries
Free Online Trading Education!
Ever felt like you wanted to become a stock trader, but didn't know where to begin? Well, begin with our free stock trading course, and you'll be on the fast track.
Free Trading - 101 Course
Trading - 101 Course
New to trading? Great. No prior experience required! Our Free trading course breaks down the basics of stock trading, ensuring you get off to a confident start.
Stock Trading Videos by Expert Traders:
Discover high-quality videos by expert technical analysts. Experience trades and stock market commentary from our Grok Trade mentors and delve into their strategic decision-making.
NOTE: These trading videos are of the live stock market and real and simulated trades.
Charts powered by TradingView
(best chart school online!)
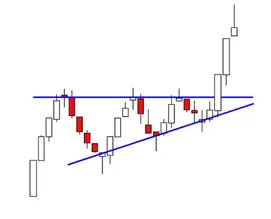
Interactive Chart School:
Learn the art and science of technical analysis with our interactive chart school. Discover powerful chart patterns and explosive trading setups, grasp the intricacies of candlestick reversal patterns, and learn about some of the most powerful indicators and oscillators used in the market today. Access now.
NOTE: The charts within the Indicator/Oscillator section use live active charts (delayed). Input your own ticket symbols and see what the indicators show you. Great for swing trading.
Charts powered by TradingView

Desire to be a successful trader?
Desire to be a successful trader?
Take your trading education seriously. The shortcut (and there is only one) to establish your trading
foundation the fastest and easiest way is via a trading mentor. PERIOD! Don't buy another trading book or sit through another trading webinar. It's not about more information, but rather the assimilation of that data. Mentors are the secret to putting it all together for you -- not Books and webinars. Click here for the details.
EVERYTHING YOU NEED: Provides you experienced insights, strategies, and feedback
MITIGATE RISK: Avoid costly errors
RULES BASED: Manage emotional decision-making
ACCOUNTABILITY: Fosters discipline
CONFIDENCE: Gain confidence in trading in the live markets
FASTEST WAY TO LEARN: A trading mentor accelerates your learning curve. Investing in a mentor is an investment in the fastest most efficient manner to become a savvy trader.
WE ARE ACTIVE TRADERS

Free Trading Videos.com, Inc. dba Grok Trade was founded by Des Woodruff (aka d-seven/d7), an established hedge fund owner and retail trader himself.
Free Online Trading Education serves as a no-nonsense hub for free but serious trading expertise. With Des's ascent from a hands-on retail trader to a sought-after mentor who's shaped curriculums for leading education platforms, and alongside Mark Suffron, a day trading maestro with over 25 years of trading experience, our platform is fueled by over three decades of frontline trading experience. Our ethos is simple: we cut through the clutter, equipping our traders with the precise knowledge and practical strategies necessary for profitability in the dynamic world of stock trading. We are the seasoned guides you need—committed, sophisticated, and always at the coalface of the markets.