
Point and Figure Chart
|
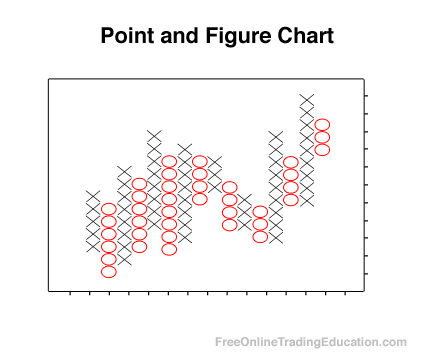
Definition:
A Point and Figure Chart is a type of chart used by technical analysts to plot price movements without incorporating time. It is comprised of a series of stacked "X's" or "O's", with the "X's" representing rising price and the "O's" representing falling price. Practical Use: The Point and Figure chart helps technical analysts "filter out" insignificant price movements to aid in the identification of support and resistance areas. In addition, time is removed from the analysis process which can be helpful. |
Get 6 (downloadable)_ trading tutorials emailed to you right now--FREE.

Point & Figure Chart Active Example
SPY chart by TradingView