• Trading Videos
  • Chart School
    • Chart Analysis >
      • Arithmetic-Linear-Scales
      • Candlestick Chart
      • Downtrend
      • Line Chart
      • Point and Figure Chart
      • Resistance
      • Down Gap
      • Swing High
      • Swing Low
      • Support
      • Time Frame
      • Up Gap
      • Western Bar Chart
    • Candlestick Reversal Patterns >
      • Abandoned Baby Bottom
      • Abandoned Baby Top
      • Bearish Doji Star
      • Bearish Engulfing
      • Bearish Harami
      • Bullish Doji Star
      • Bullish Harami
      • Bullish Engulfing
      • Dark Cloud Cover
      • Doji
      • Dragonfly Doji
      • Evening Star
      • Gravestone Doji
      • Hammer
      • Hanging Man
      • Inverted Hammer
      • Morning Star
      • Piercing Line
      • Shooting Star
      • Spinning Top High Wave
    • Indicators Oscillators >
      • Accumulation/Distribution
      • ADX
      • ATR
      • Bollinger Bands®
      • CCI
      • Ci Choppiness
      • Donchian Channel
      • Envelope
      • Linear Regression
      • MACD
      • Momentum
      • Money Flow
      • Moving Averages
      • On-Balance Volume
      • Parabolic SAR
      • Price Oscillator
      • Rate of Change
      • RSI
      • Stochastics
      • Williams Percent R
    • Chart Patterns >
      • Ascending Triangle
      • Bear Flag
      • Bull Flag
      • Bull Pullback
      • Bear Pullback
      • Cup and Handle
      • Descending Triangle
      • Double Bottom
      • Double Top
      • Falling Wedge
      • Head and Shoulders
      • High Base
      • Inverted Cup and Handle
      • Inverted Head and Shoulders
      • Low Base
      • Rising Wedge
      • Symmetrical Triangle Breakdown
      • Symmetrical Triangle Breakout
      • Triple Bottom
      • Triple Top
  • About
    • Contact
    • Grok Trade Education Reviews
    • Grok Trade Testimonials
    • Terms of Service (TOS)
  • More...
    • Market Closed Dates
  • Trading Blog
Free Online Trading Education
Follow Us!
{English}

Patrón Alcista - Triángulo Ascendente

Picture
Descarga 6 videos tutoriales Básicos de Trading (enviados a tu email) -- ¡GRATIS!  Haz click aquí.

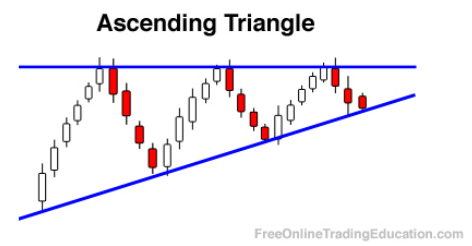
 Triángulo ascendente
 
Definición de Triángulo Ascendente:
Un triángulo ascendente es un patrón "Alcista o Bullish" formado por dos líneas de tendencia: 1) una línea horizontal ubicada en una zona de resistencia con dos picos (Swing highs) y; 2) una línea inclinada ascendente que toca una serie de "Valles Ascendentes" ("higher swing lows").


Antecedentes:
El patrón se empieza a formar cuando la acción de precio declina de manera ordenada después de un pico, como un retroceso alcista. Entonces el precio vuelve a subir hasta el pico anterior y retrocede otra vez, hasta formar otro valle, pero esta vez arriba del anterior (higher swing low"). Esta acción se repite una y otra vez hasta que una serie de picos en el mismo máximo y valles ascendentes se van formando.
La fuerza de un Triángulo Ascendente puede ser mayor is procede de un movimiento alcista anterior.
 

Uso práctico:
Los analistas técnicos saben que un triángulo ascendente es más poderoso cuando el pico que inicia el patrón corresponde a un máximo histórico, debido a la ausencia de resistencia superior. Los Traders utilizan este patrón para iniciar posiciones largas cuando el precio de la acción rompe por encima del máximo del patrón.

Picture

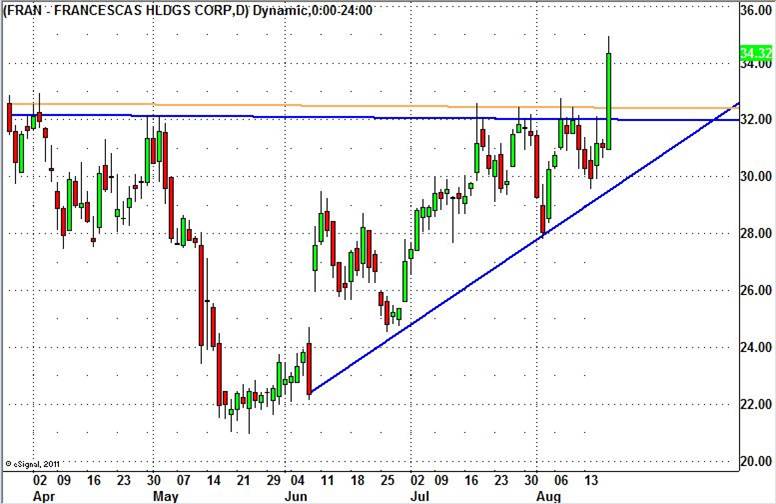
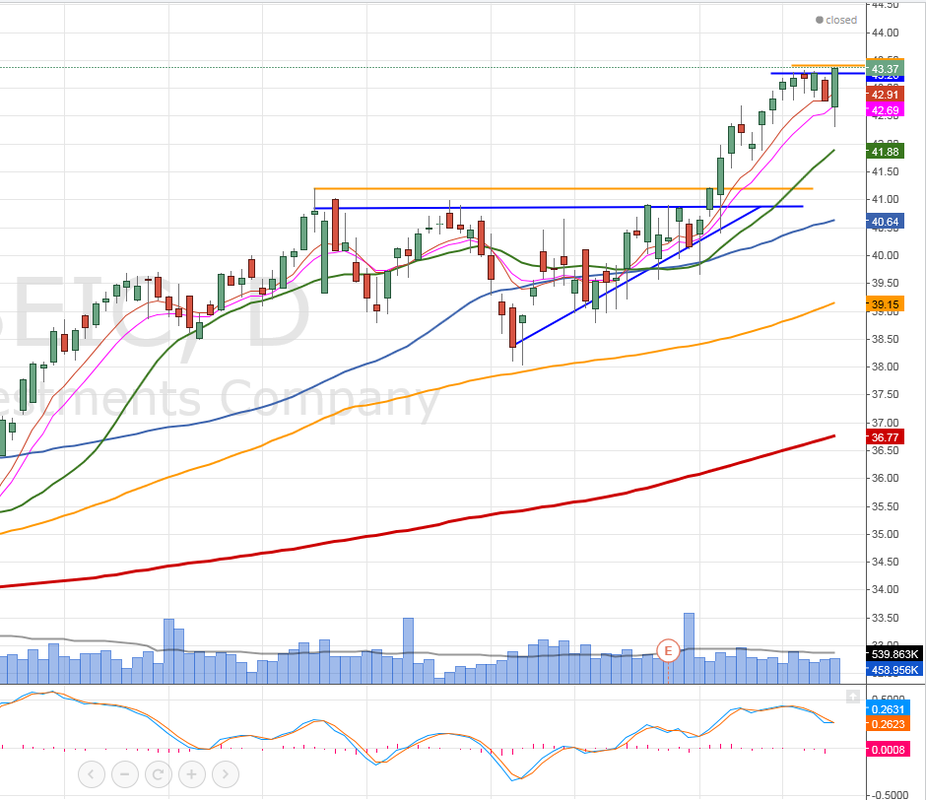
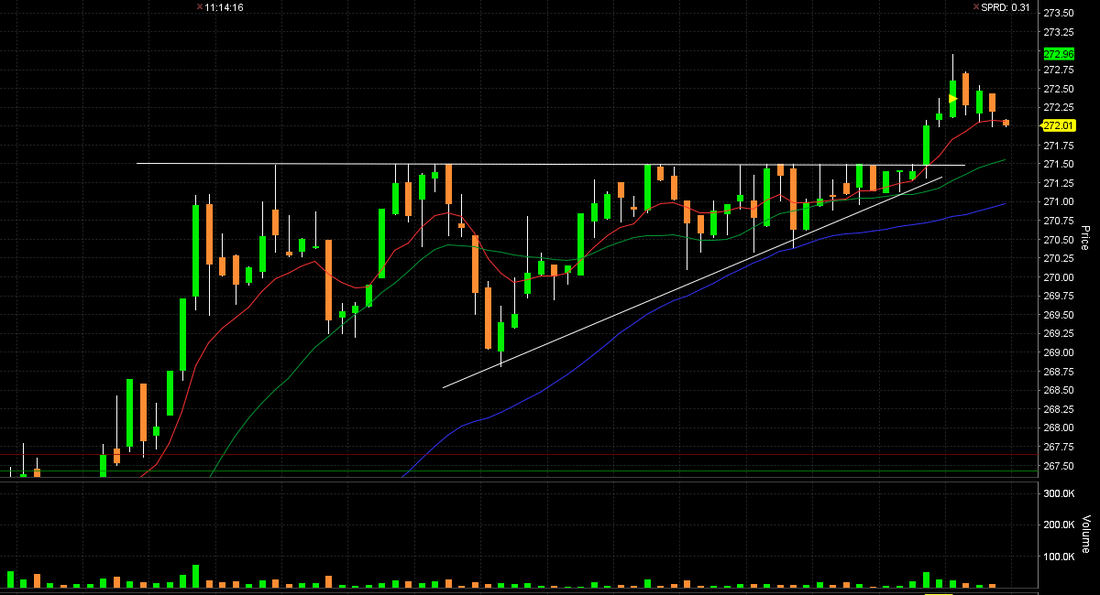
Ejemplos Reales de Triángulo Ascendente

Picture
Picture
Picture
Picture
About
About Us
How it works
Blog
Media
Support
Suggestions, Ideas & Feedback
Help
Contacts
FAQ's
Terms of Service
​Privacy Policy


Social Media
Twitter
Facebook
StockTwits

© 2007-2025  Copyright FreeTradingVideos.com, Inc. dba Grok Trade

Disclaimer: Educational Content Only
All content provided by Free Trading Videos.com, Inc. dba Grok Trade, including videos, training, and market analysis, is strictly for educational purposes and does not constitute financial, investment, tax, or legal advice. Grok Trade, its owners, partners, associates, affiliates, and third-party contributors are not registered investment advisors, broker-dealers, or financial planners. Trading securities (stocks, ETFs, mutual funds, commodities, bonds, futures, options) involves significant risk, including the potential for total loss, and you should not invest any capital you cannot afford to lose. Past performance is not indicative of future results, and hypothetical or simulated results have inherent limitations. All examples are for illustrative purposes, and users are solely responsible for their investment decisions. No guarantees are made regarding the accuracy or completeness of information provided. Use of this website constitutes acceptance of these terms. Grok Trade disclaims any liability for losses or damages resulting from reliance on our content. Always consult a licensed financial professional before acting on any information.